Long before symptoms develop, your heart often sends warning signals. Blood pressure, cholesterol, blood sugar, resting heart rate, and waist circumference are all measures of heart health that can uncover hidden cardiovascular risk years before symptoms appear. Understanding these numbers as a whole rather than individually can help you identify potential problems earlier and make focused lifestyle changes that will protect your long-term heart health.
Most people think heart disease begins when symptoms develop. “In reality, cardiovascular problems can silently develop over many years. The good news is your body also gives you clues in the form of measurable health markers.
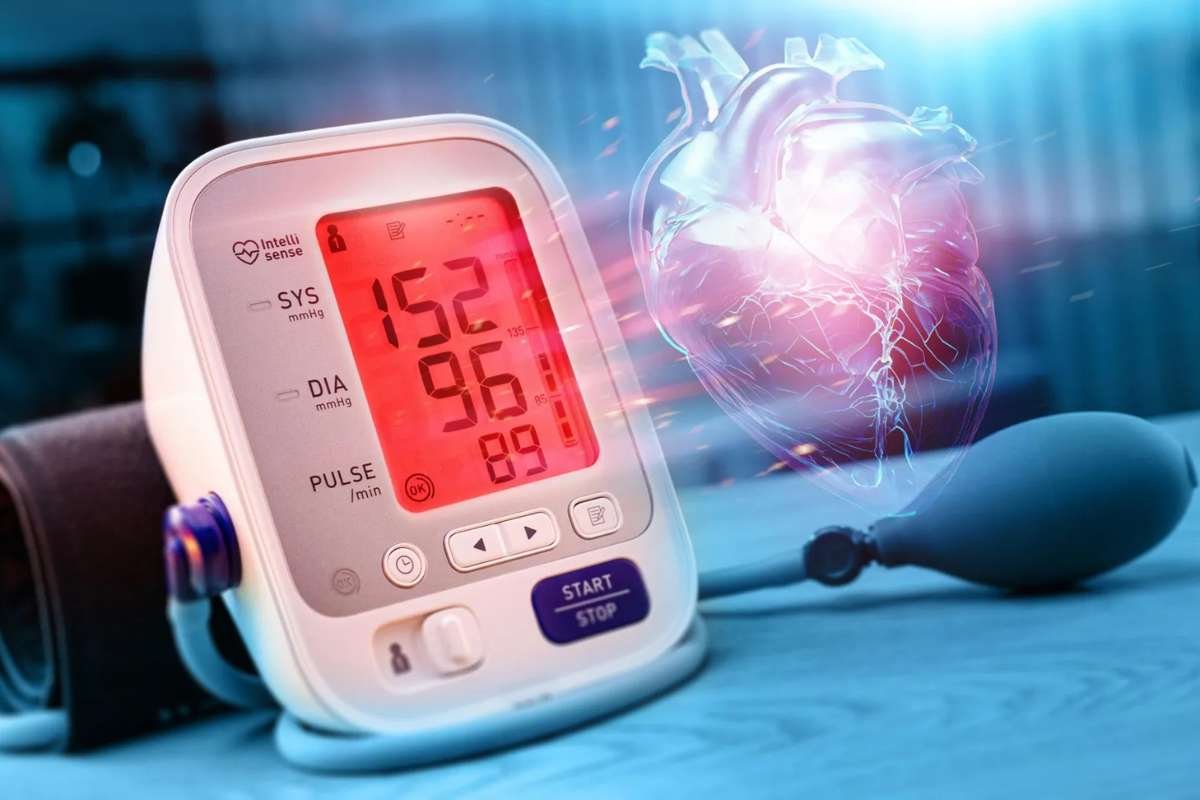
These Heart Health Numbers help show how hard your heart is working
, how healthy your arteries are, and whether metabolic changes are putting you at greater risk in the future. More importantly, a single number rarely tells the whole story. Blood pressure, cholesterol, blood sugar, body composition, and lifestyle habits often give a much clearer picture.
Knowing these numbers can help you identify potential risks before they become medical issues and provide a roadmap to improve your cardiovascular health.
Table of Contents
These are the heart health numbers every adult should track:
Tracking your heart health numbers provides a vital baseline for assessing cardiovascular status. These metrics are deeply interconnected, and evaluating them collectively yields a far more precise risk assessment than looking at any single number in isolation.
Blood pressure
- What it measures: The force of blood pushing against artery walls.
- Ranges: Normal is less than 120/80 mmHg. Elevated is 120–129/<80 mmHg. High (Hypertension Stage 1) is 130–139/80–89 mmHg.
- The “Silent” Factor: Hypertension rarely causes noticeable symptoms, meaning it can quietly damage organs and blood vessels for years undetected.
LDL and Non-HDL cholesterol
- The Difference: LDL is the specific “bad” cholesterol that deposits fat in your arteries. Total cholesterol includes everything (LDL, HDL, and VLDL), while Non-HDL isolates all harmful, plaque-causing particles.
- The Delay: Plaque buildup (atherosclerosis) accumulates incrementally. Microscopic damage to artery walls begins decades before the vessels narrow enough to trigger symptoms like chest pain.
Blood sugar (HbA1c)
- Vessel Impact: Chronically elevated glucose chemically alters and stiffens blood vessels, making them highly susceptible to injury.
- Hidden Risk: Prediabetes (HbA1c of 5.7% to 6.4%) silently accelerates blood vessel damage long before a formal diabetes diagnosis occurs.
Triglycerides
- The Indicator: These fats store unused calories. High levels heavily predict arterial hardening and are tightly linked to insulin resistance, a state where cells ignore signals to absorb glucose.
Waist Circumference
- Belly Fat Matters: Visceral fat wrapped around abdominal organs is metabolically active, secreting inflammatory chemicals that directly elevate metabolic and heart disease risk far more than subcutaneous fat elsewhere.
Resting heart rate
- Fitness Metric: It measures how many times your heart beats per minute at rest. A lower rate generally reflects a strong, efficient heart muscle.
- When to Worry: A consistently elevated resting rate (above 100 bpm) can signal underlying cardiovascular stress or poor conditioning.
Why these numbers are monitored together
These metrics interact: insulin resistance raises blood sugar, triglycerides, and blood pressure while lowering HDL. Tracking them together reveals metabolic syndrome, the cluster that dramatically increases heart disease risk more than any single number alone.
Why these numbers can predict problems before symptoms appear?

Heart disease usually develops quietly
Artery damage begins 10 to 20 years before you feel it. Plaque builds up quietly, and your heart creates detour pathways that mask the warning signs.
Symptoms only appear once a blockage is severe (70% or more) or if it suddenly ruptures. Until that happens, you can have major blockages and feel completely healthy.
The difference between risk markers and symptoms
Risk markers are measurable indicators that predict future risk. Symptoms are what you feel when damage has already occurred. Readers often confuse them, thinking “no symptoms = no problem”.
Examples of Silent Progression:
| Condition | Risk Marker (Early) | Symptom (Late) |
| High cholesterol | LDL >130 mg/dL | Chest pain during exercise |
| Hypertension | BP 130/80+ | Enlarged heart, stroke |
| Diabetes | HbA1c 5.7–6.4% | Nerve damage, kidney failure |
| Coronary artery disease | Calcium score >0 | Heart attack |
People with diabetes are especially at risk for silent ischemia. It is reduced blood flow with no pain. Because nerve damage blocks pain signals.
How early changes show up in lab results first
Lab results catch issues early, before physical damage occurs:
- Cholesterol: High LDL signals early plaque buildup before arteries narrow.
- Blood Pressure: Readings above 140/90 mmHg show arterial stress before heart damage.
- Blood Sugar: Rising HbA1c shows glucose-damaging vessels before diabetes develops.
- Triglycerides: Levels over 150 mg/dL flag insulin resistance before symptoms appear.
Routine screenings catch these shifts early, allowing you to reverse the trend with lifestyle changes or medication before a heart attack or stroke happens.
The most important heart health numbers and their healthy ranges:
Here is the quick-reference guide to the vital metrics that dictate your overall cardiovascular health.
| Marker | Healthy Range | Why It Matters |
| Blood Pressure | Less than 120/80 mmHg | Protects artery elasticity and reduces heart strain. |
| HbA1c | Less than 5.7% | Prevents glucose from damaging the vessel linings. |
| LDL Cholesterol | Optimal: Less than 100 mg/dL * | Controls the primary building block of arterial plaque. |
| Triglycerides | Less than 150 mg/dL | Indicates how efficiently your body processes and stores fat. |
| Resting Heart Rate | Typically 60–100 bpm | Reflects cardiovascular fitness and heart muscle efficiency. |
| Waist Circumference | Men: <40 inches | Women: <35 inches | Flags visceral belly fat, a major driver of metabolic disease. |
- Blood Pressure: High pressure tears artery walls, speeding up plaque buildup.
- HbA1c: Elevated blood sugar damages blood vessels before diabetes develops.
- LDL Cholesterol: This “bad” cholesterol sticks to artery walls, causing blockages.
- Triglycerides: High levels flag insulin resistance and metabolic issues.
- Resting Heart Rate: Lower rates show fitness; higher rates signal cardiac stress.
- Waist Circumference: Belly fat releases harmful chemicals that attack your heart.
Why Monitor Together: They interact. One issue (like insulin resistance) can spike your blood sugar, triglycerides, and blood pressure at the same time. Tracking them together catches metabolic syndrome, which multiplies your heart risk far more than any single number alone.
What happens when several numbers are slightly elevated?

The “Borderline Risk” Zone Most People Ignore
Example of borderline values:
- Slightly high blood pressure: 130–139/80–89 mm Hg (prehypertension)
- Mildly elevated LDL: 130–159 mg/dL (near optimal)
- Prediabetes range HbA1c: 5.7–6.4%
Individually, each may not seem alarming, and often goes untreated
Together, Risk can increase significantly. People with 4+ borderline risk factors have a 10-year coronary heart disease risk exceeding 10%. Similar to having elevated risk factors.
Why doctors look at patterns instead of single values
Doctors assess cumulative risk because risk factors multiply each other’s effects. A person with diabetes and high blood pressure is 4 times more likely to develop heart disease than someone with neither condition. The more risk factors you have, the higher your overall risk of heart disease.
Prediabetes alone may not significantly increase cardiovascular risk, but when combined with hypertension, risk rises dramatically. Atherosclerosis develops from combined exposure to high blood pressure, cholesterol, and blood sugar over time.
Real-world example of combined risk
Consider a person with isolated high cholesterol versus someone with three borderline markers:
| Scenario | Risk Profile | Cardiovascular Impact |
| Person A | Only LDL is high (140 mg/dL) | Moderate, slow plaque risk; healthy vessels compensate. |
| Person B | Borderline LDL, BP, and Sugar | Extreme risk. Multiple minor stressors accelerate vessel aging simultaneously. |
Which heart health numbers matter most at different ages?
Your cardiovascular risk changes over time. Prioritizing specific metrics at different stages of life helps you catch problems when they are easiest to reverse.
In your 20s and 30s: prevention
- Blood Pressure: Check yearly. Early high blood pressure severely strains blood vessels over time.
- Waist Circumference: Tracks dangerous belly fat before it impacts your blood work.
- Habits: Establish healthy diet and exercise routines to prevent baseline damage.
In your 40s and 50s: the shift
- Cholesterol: Plaque accumulates rapidly now; get a full lipid panel every 4 to 6 years.
- Blood Sugar: Routine HbA1c screening should start at age 45 to check for hidden prediabetes.
- Metabolic Trends: Doctors track lipids and sugar together to flag early metabolic disease.
After 60: active management
- Blood Pressure: Arteries naturally stiffen with age, making tight control crucial to prevent strokes.
- Diabetes Management: Strict glucose control protects aging microvessels from damage.
- Overall Assessment: Physicians use calculators to review all your numbers and guide therapy.
The Takeaway: In your 20s and 30s, focus on habits and blood pressure. In your 40s and 50s, prioritize blood chemistry. After 60, focus on strict management to protect your heart from permanent damage.
When your numbers suggest it’s time to speak with a doctor?

Knowing when to move from self-tracking your heart health numbers to consulting a physician is critical for preventing cardiovascular events.
1. Sudden changes matter
A sharp, unexpected spike in any metric requires immediate medical attention. For instance, a sudden jump in blood pressure above 180/120 mmHg indicates a hypertensive crisis, while a rapid, unexplained increase in resting heart rate over 100 bpm signals acute cardiac stress.
2. Consistent trends matter more
Do not panic over a single high reading, which can be caused by temporary stress, caffeine, or poor sleep. Instead, look for a pattern. If your blood pressure, fasting glucose, or cholesterol levels remain elevated across three separate readings over a few weeks, your body is flagging a chronic issue that requires a doctor’s evaluation.
3. Questions to ask at your next check-up
Take an active role in your care by bringing these specific questions to your physician:
- Which of my heart health numbers concerns you the most?
- What is my overall cardiovascular risk score based on my combined metrics?
- Which specific lifestyle change will have the greatest impact on my numbers?
- How often should I recheck these metrics to monitor my progress?
Read More: How to Keep Your Heart Healthy With Simple Daily Habits That Actually Work?
Conclusion:
Heart disease doesn’t come with warning signs; it develops slowly over the years. Good news? Your Heart Health Numbers may provide early warning signs for intervention before damage is irreversible. It’s not just one number; blood pressure, cholesterol, blood sugar, waist circumference, and resting heart rate together tell you the whole story of your cardiovascular risk.
It’s about recognising patterns and not just a single reading. One bad high number can be less dangerous than a handful of borderline numbers. Whether you are in your 20s, building healthy habits, or over 60, dealing with existing conditions, monitoring these metrics allows you to take action early.
Schedule your next check-up, ask about your cardiovascular risk score, and start tracking your numbers. Your future self will thank you for the prevention work you do today.
FAQ:
1. What are healthy heart numbers?
Cardiovascular disease (CVD) remains the leading global cause of death. It claims roughly 17.9 million lives annually worldwide.
2. What should a 70-year-old’s cholesterol be?
For a 70-year-old, recommended cholesterol targets depend on overall cardiovascular risk rather than age.
3. What is an alarming diastolic number?
An alarming diastolic number (the bottom number in a blood pressure reading) is 120 mm Hg or higher, which indicates a hypertensive crisis.
4. What is an unsafe heart rate by age?
An unsafe heart rate depends on your age and whether you are resting or physically active. For adults, a resting rate above 100 or below 60 beats per minute (bpm) is generally abnormal.
5. What should a 70-year-old’s triglycerides be?
For a 70-year-old, a healthy triglyceride level is below 150 mg/dL.
Links and Sources:
https://www.nyp.org/heart/when-to-see-a-cardiologist
https://www.sciencedirect.com/science/article/pii/S2589537023004078
https://www.webmd.com/heart/features/do-you-know-your-heart-numbers